IN THE SPOTLIGHT
Abstract submission open


ICOS CURVE
The ICOS Curve, an interactive web service, shows the dynamics and trends in CO2 levels in the atmosphere above Europe. It allows for comparing CO2 levels from different ICOS Atmosphere stations with European and global averages. Visit the ICOS Curve pages to learn more.
SHORTCUTS
High-quality, open greenhouse gas data & services
Scientific knowledge for better decisions
Tools & services for ICOS people, stations & countries
Open data & knowledge to slow down climate change
DISCOVER ICOS DATA
Start with ICOS main data products which group datasets by themes from all our stations. To find more specific observational data from our ecosystem, atmosphere and ocean stations, or elaborated products produced from ICOS and/or other datasets, select a data type and a theme below.
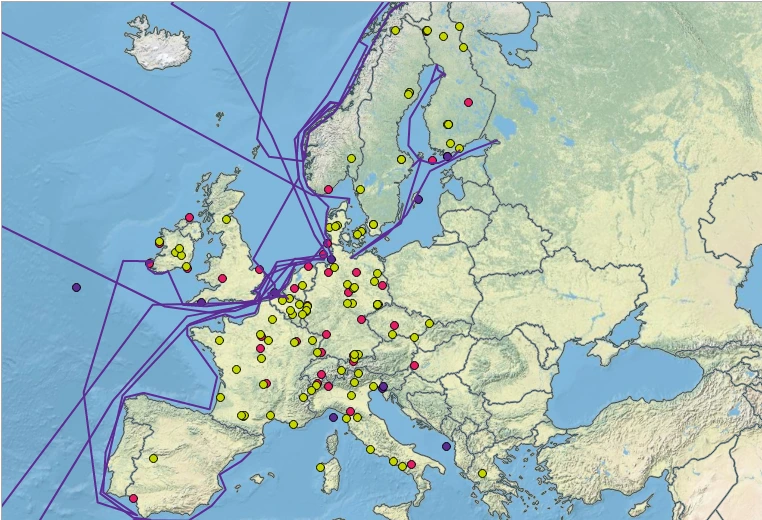
ICOS STATION NETWORK
The ICOS stations are coordinated and run by the ICOS National Networks in the 16 member countries. The stations in the National Networks operate in three distinct domains: Atmosphere, Ecosystem and Ocean.
Image