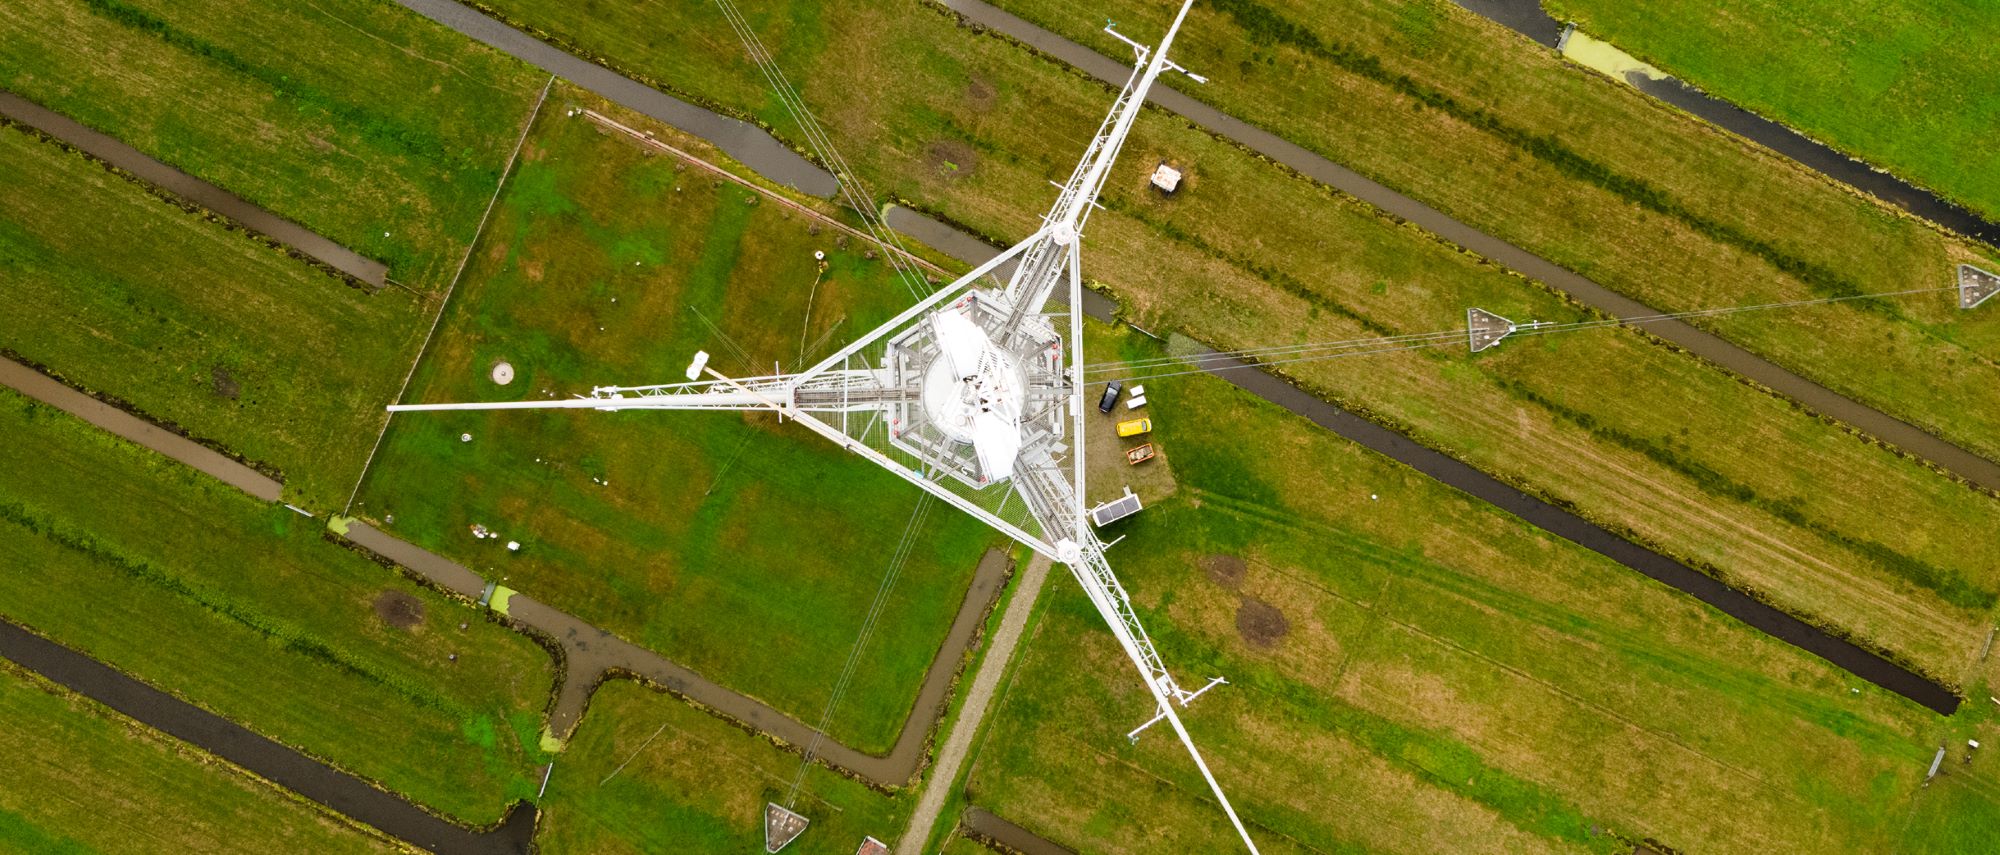
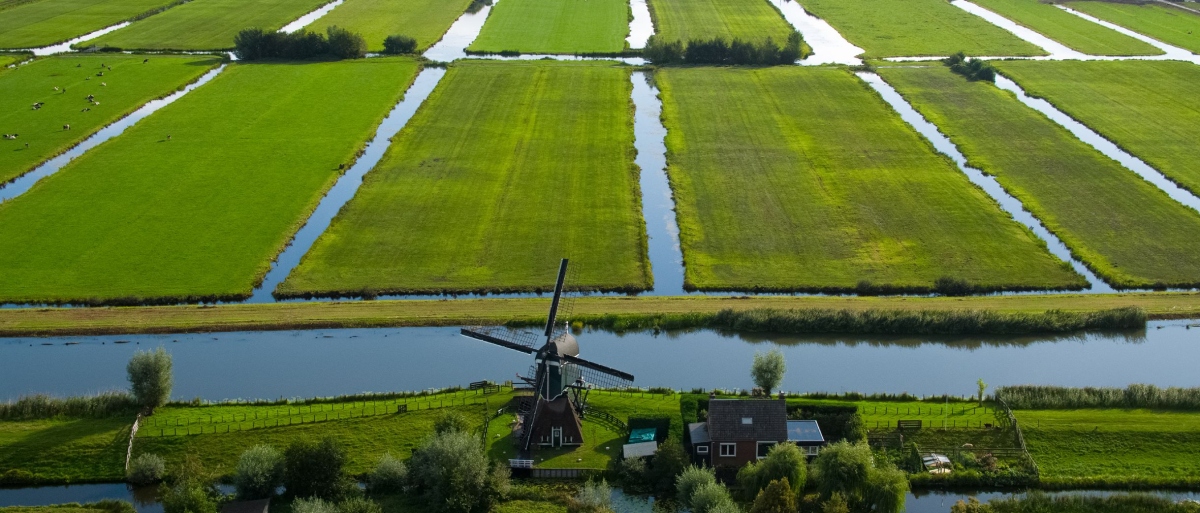
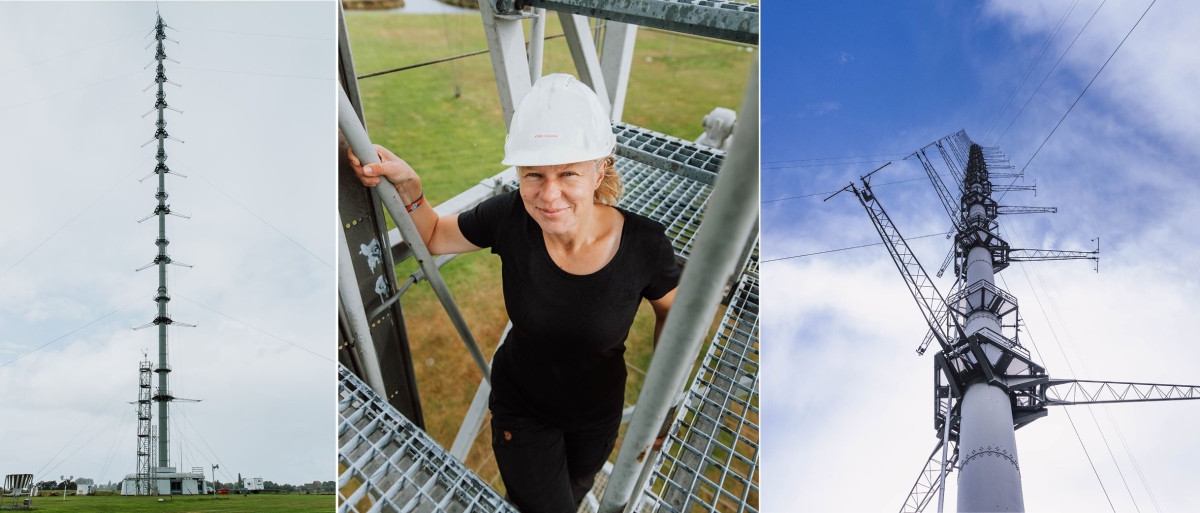
In the midst of widespread green peat fields, wooden windmills and lazy sheep strolling around, the ICOS Cabauw station tower stands 213 meters tall. Located in between the triangle of Rotterdam, Utrecht and Amsterdam, the tower picks up both rural and urban emissions in the Netherlands.
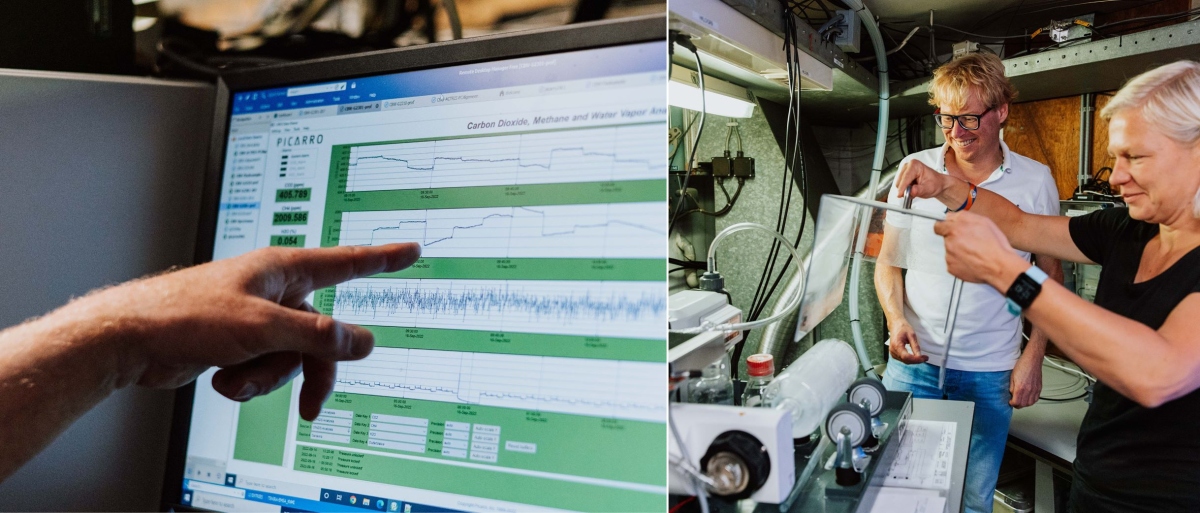
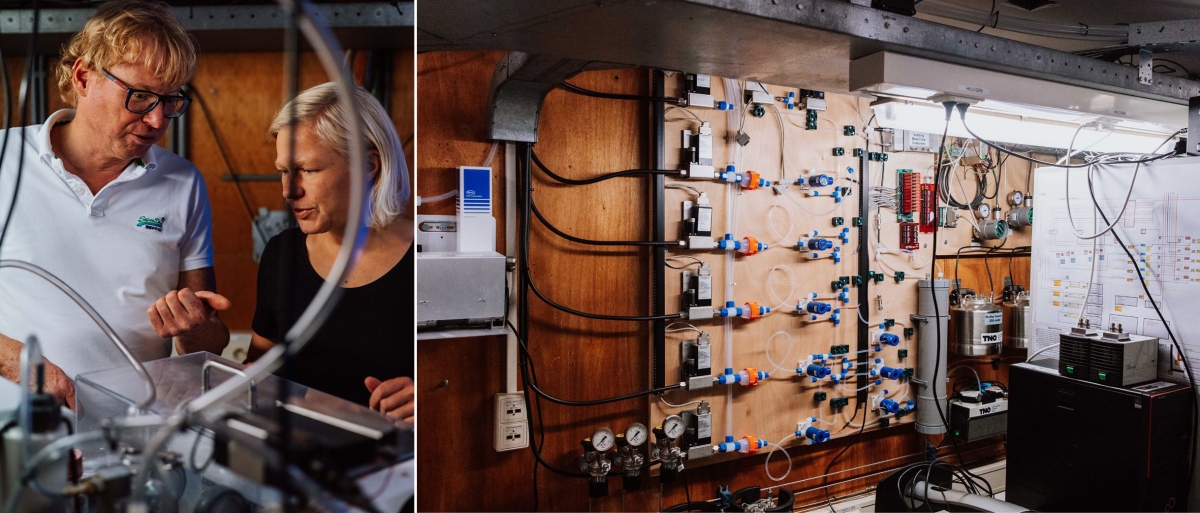
Miles away from the station, the massive tall tower can be seen on the skyline. Surrounded by impressive greenery, bleating sheep and a lonely swan floating in the nearby river, the tower watches over a small bunker-like building: the Cabauw Observatory. Walking up towards the grey concrete construction, we are greeted by a warm smile from ear to ear. The ICOS Station & Instrument PI Arnoud Frumau (TNO) is visibly excited to invite us in and when entering, the grey bunker turns into a spacious and luminous office space. A narrow spiral staircase takes us down where the magic happens – in the basement the extensive ICOS measurement equipment lightens up the room:
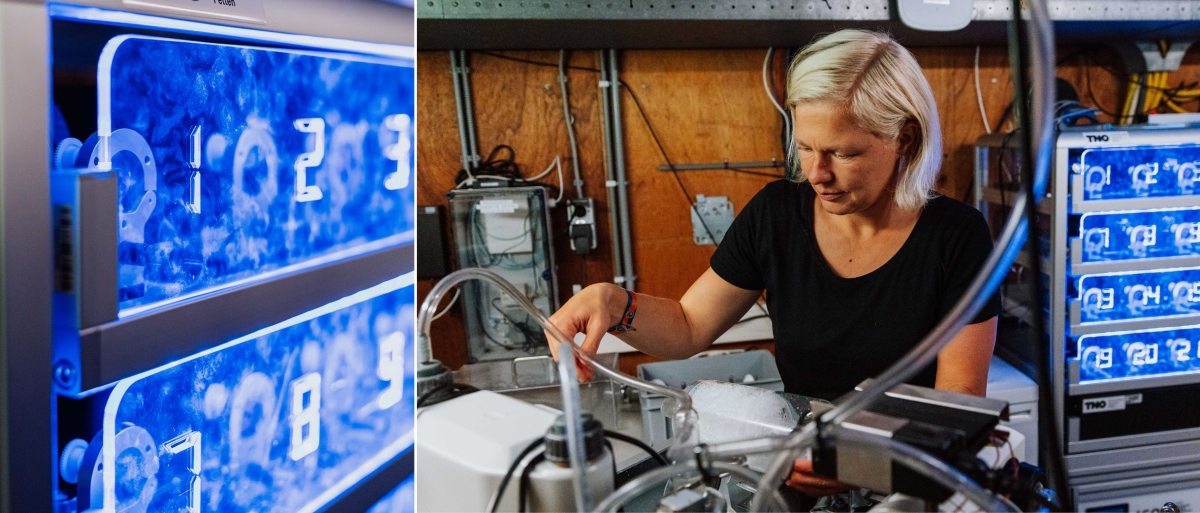
“Here we are doing measurements of greenhouse gases, CO2, methane, N2O and CO as a basic. Apart from that we measure radon on two levels which is a recommended parameter for ICOS and helps with the model evaluation. With the flask sampler we do the quality control of the greenhouse gas measurements,” Arnoud explains.
Photos: Manda Production/ Sander Karsen
The Cabauw station has the capacity to measure the whole atmosphere from the ground to the top of the troposphere for clouds, aerosols, atmospheric pollution and greenhouse gases. The in-situ measurements are done at four levels: 207 meters, 127, 67 and 27 meters. Remote sensing instruments cover the upper atmosphere.
“If you measure at 207 meters you see an average of what your country is emitting on a larger area, if you measure at a lower level, for example at 27 meters, you see the emissions more close by. Those levels in between, they detect emissions on a very local to a very distant area. In ICOS, the intention is to measure on a higher level so you have more of an average of a larger area. However, if you want to quantify the local emissions your interest is also on the lower levels,”, says Arnoud.
Photos: Manda Production/ Sander Karsen
50 years old tower
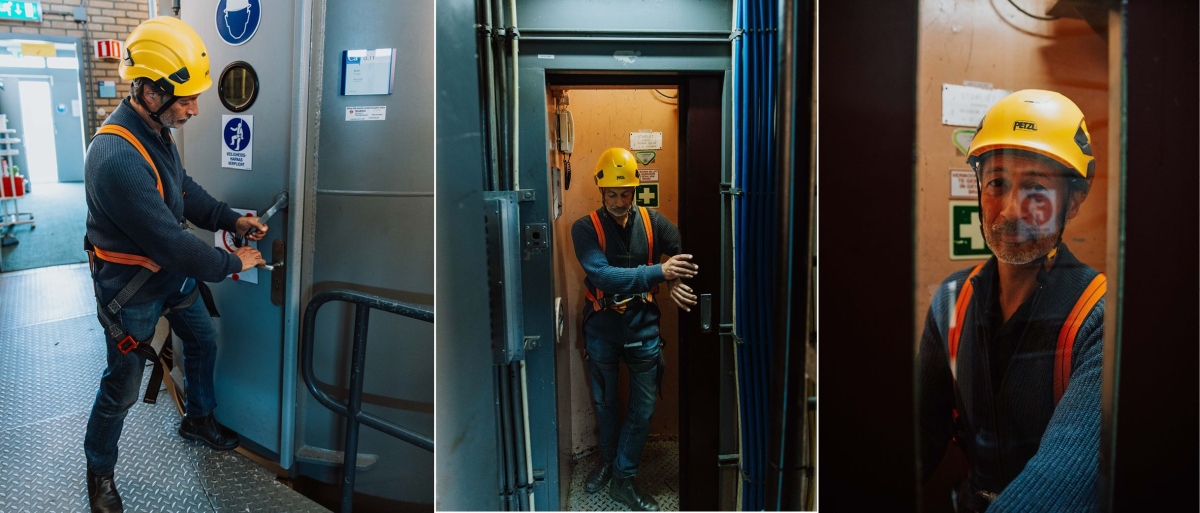
Right in the middle of the spiral staircase, a cylinder formed construction with a big heavy hatch catches our attention. The door is covered with warning signs and secured from the outside. The Cabauw Observatory Scientific Coordinator Arnoud Apituley (KNMI) appears wearing some climbing gear and a helmet:
“To go up the tower one needs to have a permission and always use this safety gear.”
Behind the heavy door a narrow elevator is hiding, to take him up to the top of the 213 meter tower. PI Arnoud Frumau joins the discussion:
“We’re lucky to have an elevator. It’s a lot easier than climbing up the stairs as others have to do in the ICOS network. Sometimes it’s more difficult due to safety regulations but we are in a nice position. Now and then we need to go up to those levels to control the inlet and to change filters, or do controls to see if there are leaks in the system.”
Photos: Manda Production/ Sander Karsen
Before entering the elevator, Arnoud Apituley gives us an insight in the long history of the station:
“The tower was built in early 1970’s so it’s already 50 years old. From the beginning it was intended to understand dispersion of air pollution and the link with meteorology. In 1992, we started with greenhouse gas measurements. For measuring greenhouse gases, and seeing where the emissions come from, meteorology is a very important aspect. The meteorological tower provides all the background information that is needed to understand the greenhouse gas situation.”
Arnoud Apituley calls the station a supersite, since it collects a very wide range of atmospheric data:
“We do not only measure the physical composition of the atmosphere but also the chemical composition. That makes this a unique atmospheric research station,” he says and continues:
“The tower has observation platforms every twenty meters, and with booms extending in three directions we can provide observations independent of the wind direction. To measure greenhouse gases, it’s not sufficient to measure just at one level. You need to have a tower as high as possible and connect the measurements to atmospheric dynamics, such as wind.”
Photos: Manda Production/ Sander Karsen
Verifying data through bottom-up inventories
In addition to the in-situ data that the tower sensors provide, the Cabauw station has a wide range of remote sensors around the tower as well, Lidars and radars, to measure not only meteorological aspects, wind, cloud properties, precipitation, aerosols, but a very wide range of subjects.
“Combining measurements and models, one can see from which part of the surrounding areas the emissions are coming. That way we can compare our data to what the national governments are reporting to the IPCC, using bottom-up inventories. These measurements are used for the verification of data, that’s very important,”, Arnoud Frumau concludes.
Photos: Manda Production/ Sander Karsen
At nighttime, the Cabauw data flows into the ICOS network data base, the Carbon Portal, so it’s readily available for everyone to use. ICOS is playing a key role in offering transparent monitoring, reporting and verification support for national greenhouse gas emissions in Europe, in accordance with the Paris Agreement.
“The ICOS network offers a common process, providing mutual calibration scales, cylinders, it’s not only data but also knowledge sharing. Twice a year we have common meetings where we share our problems and learn from each other.
Photos: Manda Production/ Sander Karsen
Moving outside, we see Ilona Velzeboer, ICOS Instrument PI (TNO), who’s about to climb up the smaller measurement tower at the site. She prefers to spend her days at the Cabauw station than in the office at the institute:
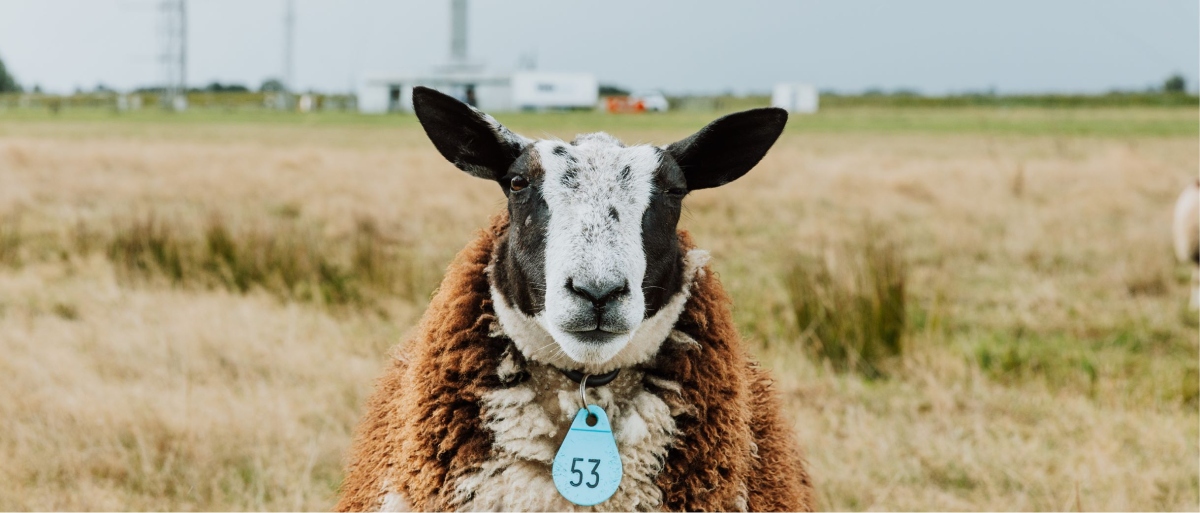
“It’s never the same. It’s nice to be in the field, not only measure but also validate your models. When working in the field it’s always different, sometimes there’s sheep running around, sometimes it’s sunny, sometimes it’s raining,” she says with a big smile on her face gazing towards the herd of sheep on the field next by.
“Everything can happen, that’s what makes everyday a special day. To see what’s happening in the air, what kind of components are coming around, how they behave, and also that we can measure them in those local situations. It’s nice to get your own data, so you can explain what happened when looking at that data, like ‘oh it was that day when it was raining or the sheep were running around’.”
Photos: Manda Production/ Sander Karsen
Photos: Manda Production/ Sander Karsen, Tom Oudijk,Dennis Manda
Text: Charlotta Henry/ICOS ERIC